Modern ad revenue analytics dashboards should combine core revenue and yield KPIs with diagnostic metrics across partners, placements, formats, and regions. Built on data from ad servers, SSPs, and exchanges, they provide a unified view of monetization performance. A white-label SSP/exchange can serve as a clean analytics hub, enabling deeper auction insights and optimization.
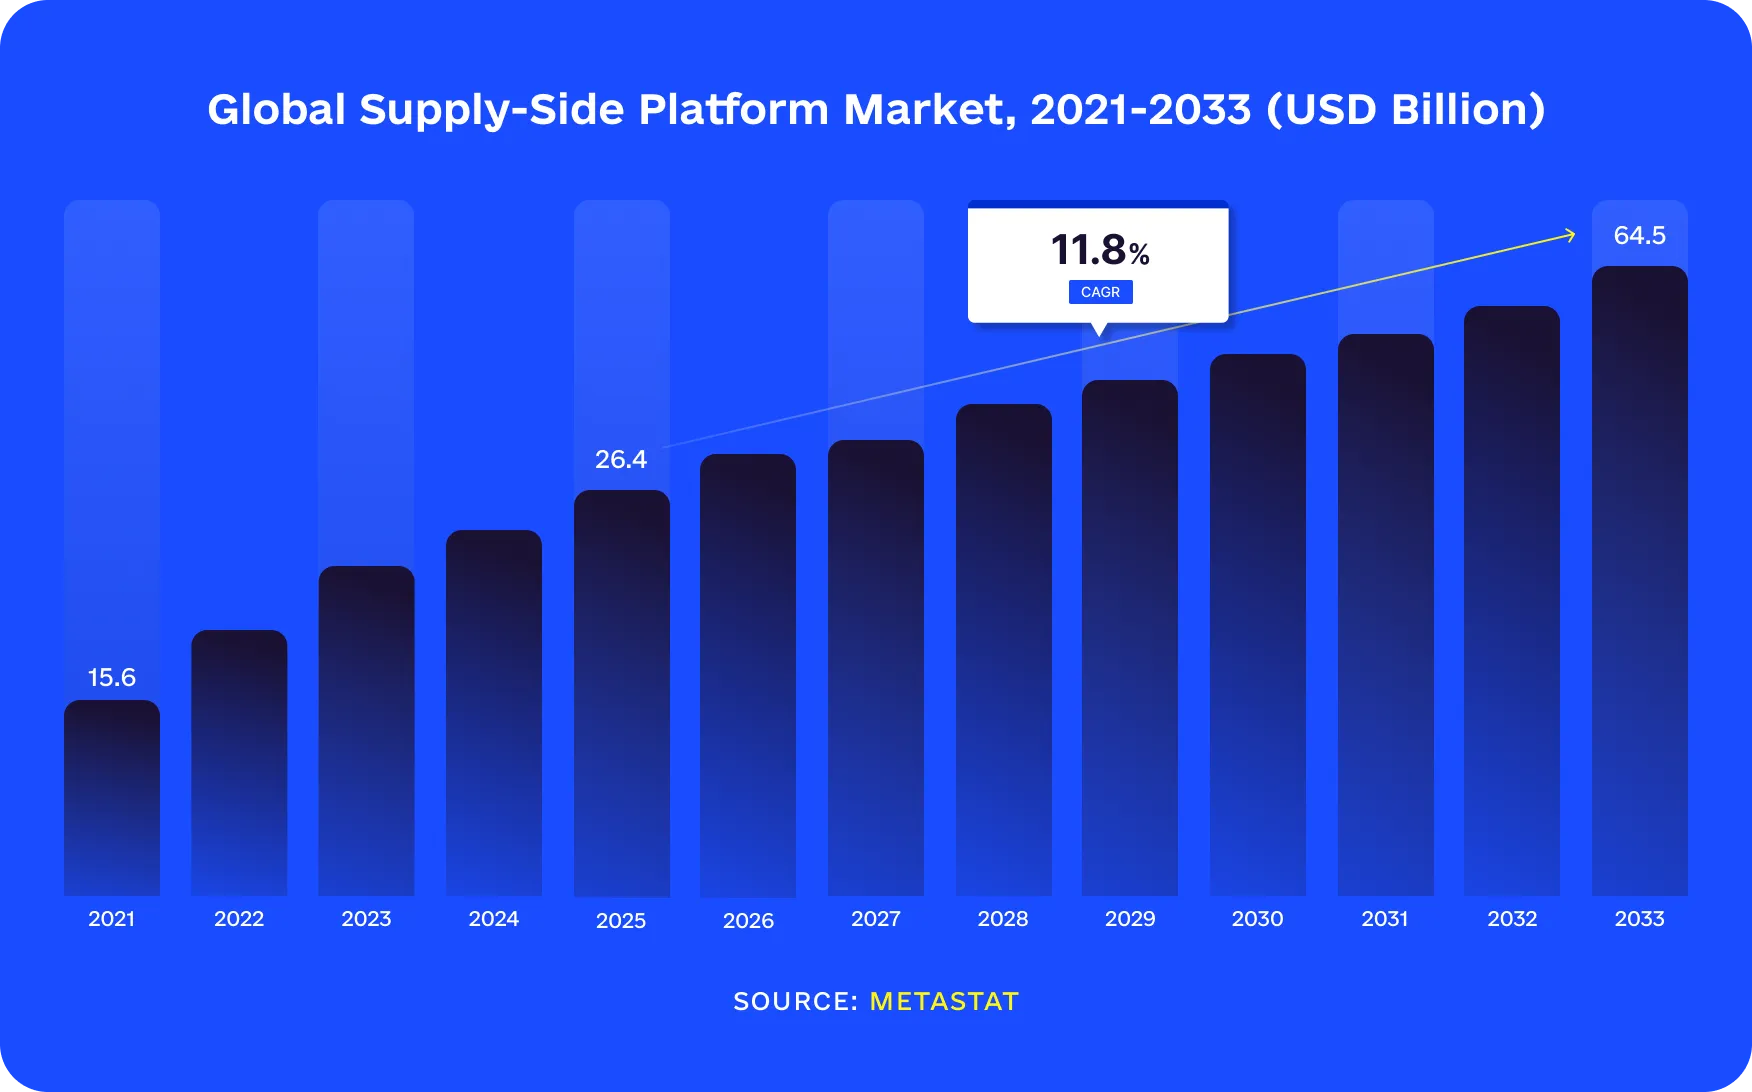
The modern monetization environment is highly fragmented. Revenue comes from a range of channels and platforms – it is generated via direct campaigns, programmatic open auctions, private marketplaces, guaranteed deals, etc. At the same time, audiences are spread across multiple environments, including websites, mobile apps, and CTV. The growing number of technologies (SSPs, networks, servers, exchanges, etc.) contributes to the complexity of the advertising ecosystem. For instance, the global SSP market is forecasted to expand at a CAGR of 11.8% from 2026 to 2033 and surpass $64 billion by 2033.
However, while executives need a unified performance view, built‑in reports from each tool are siloed and often not aligned with how leadership thinks about revenue. This makes it challenging to understand which audiences generate the most value, which inventory performs best, where monetization opportunities are lost, and so on.
In this guide, we will take a deep dive into ad revenue analytics dashboards for publishers. We will explore what metrics matter, how to assemble data from different AdTech components, and how having your own exchange/marketplace layer can help you enhance your strategy. Read on to learn more.
Why publishers need purpose-built ad revenue analytics dashboards
As monetization strategies become more complex, publishers need more than basic performance reports from individual platforms. However, AdTech solutions rarely provide the complete business picture a publisher needs to manage revenue effectively.
The limits of default ad server and SSP reports
Most AdTech platforms offer sufficient programmatic revenue analytics capabilities. The challenge here is that each solution has its own approach to analytics; thus, each of them can reflect only a specific part of the monetization process. Besides, these reports are rarely structured around the way publishers actually run their businesses. Finance teams usually need revenue visibility by property, market, business unit, etc. Sales teams want to understand advertiser demand and deal performance. Product teams need insights into user experience and monetization opportunities across different platforms. Meanwhile, AdOps teams need operational data to optimize auctions and inventory performance.
When data remains separated across multiple tools, publishers often end up creating manual spreadsheet-based reports that combine information from different sources. Such reports require constant maintenance, depend on manual exports, and are simply hard to trust. If we summarize the main challenges in terms of publisher ad revenue reporting and analytics, they would be as follows:
No single source of truth for revenue and yield. Different platforms may calculate metrics differently, making it difficult to understand actual revenue performance across channels.
Limited visibility into monetization efficiency. Publishers struggle to define which SSPs generate the highest revenue, which formats deliver the strongest yield, and so on.
Delayed or incomplete optimization decisions. Without consolidated and timely data, decisions about timeout settings, floor prices, inventory packaging, or deal curation are often made based on partial information.
What a good ad revenue analytics dashboard should do
The right ad revenue analytics dashboard should go beyond collecting numbers from different systems. Its role is to provide a complete view of monetization performance and help different teams make better decisions.
For instance, the dashboard should provide a unified overview of revenue, fill rate, CPMs, and yield across all monetization sources, including direct campaigns, programmatic auctions, private marketplaces, programmatic guaranteed deals, and other revenue channels.
For leadership teams, this also implies having access to strategic KPIs, such as total revenue trends, revenue contribution by channel, geographic performance, and growth opportunities. For AdOps and yield teams, the same dashboard should enable deeper analysis, allowing them to evaluate individual buyers, SSPs, placements, formats, devices, and deal types.
Note that modern publishers are increasingly switching to white-label SSP and ad exchange solutions (like the ones offered by Attekmi). Such platforms can act as a central data hub, not just a transaction layer. This creates deeper visibility into the supply chain and allows publishers to build analytics capabilities around their own business goals.
With the right data foundation, an ad revenue analytics dashboard becomes not just a reporting interface, but a strategic tool for improving monetization efficiency, partner management, and long-term revenue growth.
What to track: core ad revenue metrics for dashboards
An effective analytics dashboard should help you track a wide range of ad revenue optimization metrics, and not only. Obviously, the choice of specific metrics highly depends on your business model, as well as objectives. However, there are four areas that proper yield and monetization dashboards should cover. Let’s take a closer look at them.
Revenue and yield fundamentals
Here, essential KPIs include:
Gross and net revenue: Tracked by day, week, and month to understand revenue patterns.
eCPM: This is effective cost per mille or effective cost per thousand impressions – a key indicator of inventory value and monetization efficiency.
RPM: That is revenue per thousand page views or sessions. It is useful for understanding revenue generation from the overall user experience, not just individual ad impressions.
Fill rate: The percentage of ad requests that result in served impressions, helping identify demand gaps and inventory monetization issues.
Keep in mind that a useful dashboard should allow you to analyze revenue and yield by:
Property or website/app
Device type (desktop, in-app, CTV, etc.)
Ad format (display, video, native, CTV, and so on)
Geographic region
Monetization channel (direct sales, programmatic, marketplace, etc.)
For example, an overall eCPM increase may look positive. However, after deeper analysis, you may find out that this growth comes only from one premium CTV environment, while mobile web inventory is losing value. Granular reporting can help you understand what is actually driving revenue changes. By the way, TV and video advertising have the largest market volume – over $391 billion in 2026. Offering such placements can help you drive income, but only a proper dashboard will enable you to determine if such a strategy is efficient.
Partner- and deal-level performance
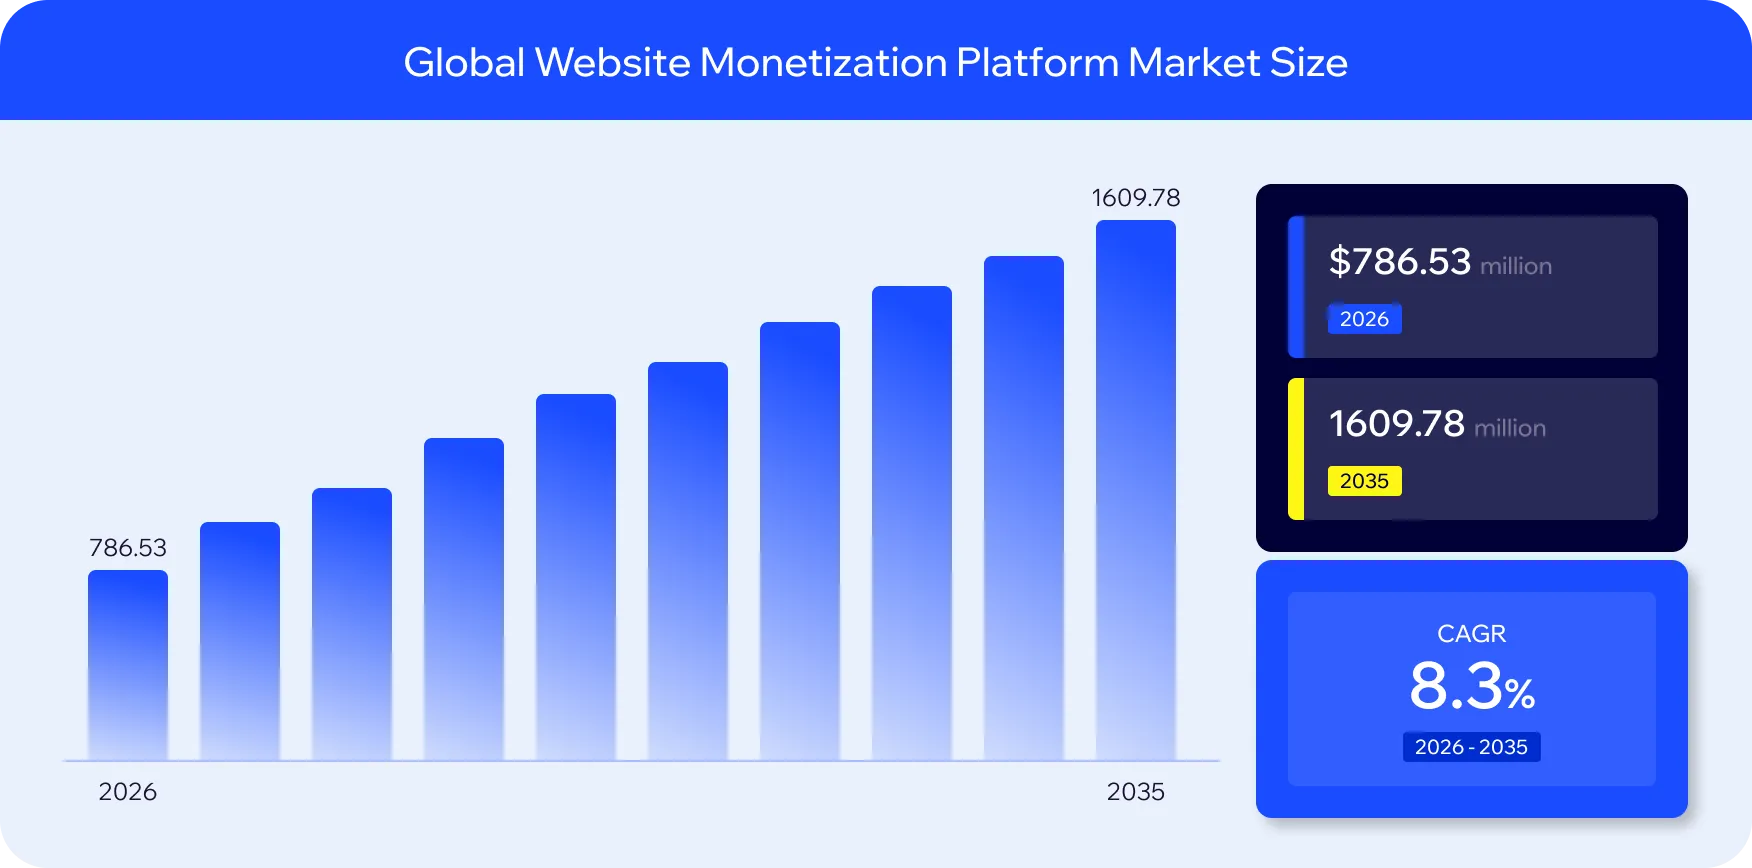
To diversify revenue sources, publishers often work with a range of media buyers and multiple programmatic platforms. For instance, the global website monetization platform market keeps growing and is expected to reach over $1609 million by 2035. Therefore, finding several relevant solutions is usually not a problem.
For every platform, it is crucial to track revenue contribution, eCPM, win rate, bid density, impression volume, and demand consistency over time. Note that performance should also be broken down by deal type, for instance, open RTB auctions, private marketplaces, programmatic guaranteed, and so on.
These insights support critical supply path optimization and partner curation decisions. For example, you can identify which SSPs consistently provide valuable demand, which partners should be prioritized, and which regional partners deliver the strongest results for specific markets.
In case you operate your own programmatic platform, additional metrics become available and essential, such as platform fees, net revenue, and others.
Inventory and placement analytics
A strong dashboard should provide visibility into which placements, formats, and inventory segments create the most value. For instance, important inventory-level metrics include performance by:
Placement or ad slot
Ad unit size
Position
Format type
Content environment
If we talk specifically about, for instance, display and mobile inventory, you may want to analyze such metrics as:
eCPM by placement
Fill rate
Viewability
Engagement indicators (like CTR)
In turn, for video and CTV environments, additional signals become important:
Video completion rate
Content type
Show genre
Device/platform
Pod position
This data can help you identify both underperforming inventory and premium segments. For example, you may discover that certain video placements consistently attract higher-value demand or that specific CTV content categories drive stronger CPMs. These insights can guide floor pricing strategies, inventory packaging, and sales positioning.
Audience, geo, and “product” lines
When possible, it would also be helpful to track:
Revenue and yield by country, region, or market
Performance by audience segment
Content category performance
User engagement characteristics
Such data enables you to understand which audiences or content create the greatest value. For example, you may discover that a sports audience generates higher programmatic demand than general news readers. This will help you adjust your strategy and monetize more effectively.
Note that the right dashboard should support separate reporting views for the key “product” lines: e.g., news, sports, lifestyle, CTV apps, and so on.
How to build ad revenue analytics dashboards (architecture and process)
The quality of insights highly depends on the quality, consistency, and depth of the data behind them (for instance, RTB analytics and log-level data). Therefore, for effective analytics, you need a data foundation bringing together signals from across your monetization stack and organizing them in the way your business operates.
Know your data sources
One of the most important steps that you should take is to determine where monetization data comes from and what level of detail each source provides. Typical data inputs include:
Ad server logs and reporting APIs. They provide information about impressions, revenue, campaigns, creatives, etc.
SSP and exchange reporting or log-level data. These are deeper insights into programmatic activity, including bid requests, bids, wins, buyers, fees, and auction dynamics.
Marketplace or white-label SSP logs. For publishers operating their own exchange or marketplace, these logs provide first-party visibility into the full auction process, including demand behavior and supply path performance.
First-party analytics data. This is traffic data, pageviews, sessions, user segments, and content analytics that help connect monetization outcomes with audience behavior.
The level of control you have over the exchange or SSP layer directly impacts the quality of analytics. Standard reports from external vendors usually provide only the metrics that those platforms choose to expose. In contrast, owning a white-label SSP or exchange infrastructure (for instance, Attekmi’s white-label solution) allows you to capture richer data and build reporting around your business objectives.
Data modeling basics
Once data sources are identified, the next task is to make them work together. Here are the data modeling steps you should take:
Normalize entity names: Ensure consistent naming across domains, apps, placements, formats, and partners. For example, the same website or mobile app should not appear under multiple variations across different systems.
Create consistent join keys: Establish common identifiers that allow data from different sources to be connected, such as ad unit IDs, placement IDs, deal IDs, etc.
Define core business “facts”: Decide which metrics represent the foundation of reporting, such as impressions, revenue, ad requests, bids, wins, and so on.
You may want your ad revenue analytics systems to rely on several core data structures. For instance:
The Impressions and Revenue fact table: Stores delivered impressions, revenue, CPMs, and related monetization outcomes.
The Requests and Bids fact table: Captures auction-level activity such as requests, bids received, winning bids, and demand participation (when exchange-level data is available).
Dimension tables: Provide the context needed for analysis, including time, property, placement, partner, deal type, region, device, and format.
Dashboard design for different stakeholders
A single dashboard rarely works equally well for every team. Different stakeholders need different levels of detail and different views of monetization performance.
For instance, leadership teams typically need a clear overview of business performance. Therefore, executive dashboards should focus on:
Total revenue and revenue trends
RPM and yield changes
Revenue mix across channels
Comparisons across regions, properties, and products
High-level growth opportunities and risks
The goal is to provide a fast understanding of where revenue is coming from and how the business is performing.
In turn, operational teams need the ability to investigate performance and take action. Yield and AdOps dashboards should include:
Partner-level performance tables
SSP and exchange comparisons
Placement-level analytics
Filters by region, format, device, buyer, and deal type
Time-range controls to compare performance before and after optimizations
For example, a yield manager should be able to quickly evaluate whether adding a new SSP improved revenue, whether changing timeout settings increased bid participation, or whether a floor price adjustment affected both fill rate and eCPM.
Finally, content-focused dashboards should connect monetization data with user experience and content strategy. These views should include:
Revenue and yield by content category
Performance by page, app, or product area
Connections between user journeys and monetization outcomes
Insights into how UX or product changes influence ad revenue
When designed correctly, ad revenue analytics dashboards become a shared decision-making layer across the organization. They allow executives, AdOps specialists, and content (or product) teams to work from the same data foundation.
Where exchanges and white‑label SSPs fit in
With a white-label ad server/SSP/exchange reporting, you can optimize your strategy even more effectively, as you have more control over both monetization and analytics processes.
Exchanges as analytics amplifiers
For instance, when you operate your own ad exchange or white-label SSP, you gain access to a much richer set of log-level data. Instead of seeing only the final impression and revenue numbers, you can analyze the entire programmatic funnel. This includes bid requests (sent and received), winning bids, partner behavior, auction outcomes, etc.
This additional visibility allows you to build marketplace/exchange analytics dashboards that enable more comprehensive reporting and, as a result, more effective decision-making. Instead of tracking only final impressions, you can see the entire auction dynamics.
This creates several key benefits:
Better supply path optimization (SPO) decisions. It becomes easier for you to identify unnecessary intermediaries and inefficiencies.
A clearer understanding of demand. You can identify which partners provide meaningful demand and which add unnecessary complexity without improving revenue.
More effective deal optimization. You can analyze how different deal structures perform over time and adjust your strategies accordingly.
How a white‑label SSP like Attekmi helps
Attekmi’s white-label monetization solution supports desktop, mobile web, in-app, and CTV environments, as well as banner, native, video, audio, and CTV ad formats. This way, you gain monetization flexibility, while a wide range of targeting and filtering settings help you create an effective programmatic environment. Additionally, Attekmi’s solution offers advanced analytics and reporting capabilities, which allow you to monitor the performance of your platform in a centralized way.
However, one of the most prominent benefits is that Attekmi’s white-label platform implies complete customization. Apart from UI personalization, you can request custom functionalities, so that the solution will be fully tailored to your needs.
Advanced analytics use cases for ad revenue dashboards
Once you have a reliable ad revenue analytics foundation, dashboards can support more than monitoring past performance. The same data can be used to run experiments, optimize the supply chains, and improve revenue planning.
A/B testing and experiment tracking
In this scenario, common use cases include:
Testing floor price adjustments by geography, placement, or inventory type to understand the impact on fill rate, eCPM, and RPM.
Evaluating new SSP integrations or header bidding partners by comparing performance against a control group or existing setup.
Comparing timeout configurations to identify the right balance between additional bid participation and page or app performance.
Testing different ad layouts or placements to understand how changes to user experience affect monetization.
Considering these, a strong dashboard should provide the ability to annotate major changes (e.g., pricing update), clear before-and-after comparisons across selected time periods, segmentation by region, device, format, placement, and partner, and easy data exports for deeper statistical analysis.
For example, you may want to compare two similar inventory groups after changing floor prices. The dashboard could show whether the higher floor increased revenue per impression or simply reduced fill without creating additional yield.
SPO and partner rationalization
Here are the key use cases to consider:
Identifying low-value partners that create additional latency but do not improve revenue.
Detecting unnecessary supply chain complexity, such as SSPs that primarily resell inventory from other intermediaries.
Comparing the regional performance of demand partners.
Evaluating partner contribution, including factors such as win rate, buyer diversity, auction participation, etc.
With auction-level data from an exchange or white-label SSP reporting, you can understand not only which partners generate impressions, but which partners actually improve auction outcomes.
Forecasting and budgeting
Last but not least, ad revenue analytics dashboards can support financial planning by connecting historical monetization performance with future expectations. Forecasting models can use historical data like traffic trends, seasonal patterns, revenue performance, fill rates, CPM fluctuations, and so on. Dashboards can then present forecast versus actual performance across key business dimensions (regions, platforms, content categories, etc.).
By creating a shared view of historical results and future expectations, ad revenue dashboards help align revenue, sales, AdOps, and finance teams around the same business goals.
Common pitfalls when building ad revenue analytics dashboards
To build an effective ad revenue analytics dashboard, you must be aware of the common mistakes. Here are the things to avoid.
Overcomplicating before you get the basics right
Investing in complex machine learning models, predictive analytics, or real-time reporting pipelines while still lacking a consistent view of basic metrics is the wrong approach. The same applies to building too many dashboards that no one actually maintains.
Instead, start with a small number of essential views that answer the majority of daily business questions:
How much revenue are we generating?
Which properties, regions, and platforms drive the most value?
Which partners and formats perform best?
Where are we losing yield opportunities?
Once these core dashboards are reliable and actively used, you can gradually expand into more advanced capabilities.
Ignoring data quality and definitions
Data quality issues are one of the biggest challenges in ad revenue analytics. For instance, different systems may have different definitions of fill rate depending on whether they measure ad requests, auctions, or served impressions. However, without clear definitions, teams may spend more time discussing numbers than acting on insights.
To avoid this problem, you should:
Document all key metric definitions
Establish clear reconciliation rules between ad servers, SSPs, exchanges, and financial systems
Define which sources are considered authoritative for specific metrics
Regularly validate differences between platforms.
Note that the exchange or SSP layer can be a reliable source of auction data and partner comparisons – consider using such a solution to make more data-driven decisions.
Conclusion
Ad revenue analytics dashboards for publishers are not optional tools. For modern media owners, they are essential infrastructure for making better decisions across monetization, supply path optimization, product strategy, and financial planning.
Keep in mind that a successful analytics approach starts with tracking the right metrics: from core KPIs (like revenue, eCPM, etc.) to deeper signals (e.g., bid density, win rates, placement performance, and so on).
The foundation of effective dashboards is structured, connected data. By combining information from ad servers, SSPs, exchanges, and first-party analytics systems, you can create a unified view of your monetization ecosystem. Having control over an exchange or white-label SSP layer can strengthen this foundation. Access to richer data, greater transparency, and more control over the processes can help you ensure more accurate analytics, make more effective decisions, and optimize monetization strategies.
Ready to launch your own monetization platform? Just contact the Attekmi team.
FAQ
Key KPIs include gross and net revenue, eCPM, RPM, fill rate, and impression volume. Publishers should also track metrics such as bid density, win rate, partner contribution, placement performance, and revenue by format, device, region, and monetization channel.
A complete view requires combining ad server data, SSP and exchange reports, auction-level logs (where available), and first-party analytics data. Connecting these sources helps unify impressions, bids, revenue, traffic, and audience insights into one monetization picture.
The right frequency depends on the use case. AdOps teams benefit from near real-time auction and performance data, while finance and leadership often need daily or weekly reports. Many publishers combine both: operational dashboards for fast decisions and aggregated reports for strategic planning.
Exchanges and white-label SSPs provide deeper auction-level visibility, including requests, bids, wins, clearing prices, and partner behavior. This data helps publishers optimize supply paths, evaluate demand partners, analyze deal performance, and build dashboards based on a controlled data source.
Built-in reports may be sufficient for smaller publishers with simple monetization setups. However, as revenue sources, platforms, and partners grow, custom dashboards become valuable for combining data, identifying optimization opportunities, and creating a single source of truth for revenue decisions.


'%3e%3cpath%20d='M415.5%20380.133C415.5%20554.655%20911.5%20609.133%20714%20818.633C447%20850.133%20200%20677.655%20200%20503.133C200%20328.611%20341.478%20187.133%20516%20187.133C690.522%20187.133%20415.5%20205.611%20415.5%20380.133Z'%20fill='%231A4CFF'/%3e%3c/g%3e%3cg%20filter='url(%23filter1_f_654_7533)'%3e%3cpath%20d='M819.862%20539.146C969.42%20389.588%20963.912%20273.412%201000.6%20310.096C1037.28%20346.78%201059.92%20590.588%20910.362%20740.146C760.804%20889.704%20503.861%20847.646%20447.362%20760.146C348.862%20547.146%20670.304%20688.704%20819.862%20539.146Z'%20fill='%23052AAE'/%3e%3c/g%3e%3cg%20filter='url(%23filter2_f_654_7533)'%3e%3cpath%20d='M647.331%20285.725C443.031%20230.983%20408.998%20311.131%20358.6%20243.729C295.498%20194.631%20571.852%2052.1078%20776.152%20106.85C980.452%20161.592%201072.5%20405.139%201024.97%20497.82C889.759%20689.623%20851.631%20340.467%20647.331%20285.725Z'%20fill='%231B4DFF'/%3e%3c/g%3e%3c/g%3e%3cdefs%3e%3cfilter%20id='filter0_f_654_7533'%20x='0'%20y='-12.8672'%20width='960.465'%20height='1035.25'%20filterUnits='userSpaceOnUse'%20color-interpolation-filters='sRGB'%3e%3cfeFlood%20flood-opacity='0'%20result='BackgroundImageFix'/%3e%3cfeBlend%20mode='normal'%20in='SourceGraphic'%20in2='BackgroundImageFix'%20result='shape'/%3e%3cfeGaussianBlur%20stdDeviation='100'%20result='effect1_foregroundBlur_654_7533'/%3e%3c/filter%3e%3cfilter%20id='filter1_f_654_7533'%20x='228.938'%20y='103.27'%20width='998.816'%20height='935.965'%20filterUnits='userSpaceOnUse'%20color-interpolation-filters='sRGB'%3e%3cfeFlood%20flood-opacity='0'%20result='BackgroundImageFix'/%3e%3cfeBlend%20mode='normal'%20in='SourceGraphic'%20in2='BackgroundImageFix'%20result='shape'/%3e%3cfeGaussianBlur%20stdDeviation='100'%20result='effect1_foregroundBlur_654_7533'/%3e%3c/filter%3e%3cfilter%20id='filter2_f_654_7533'%20x='149.441'%20y='-105.473'%20width='1087.81'%20height='860.301'%20filterUnits='userSpaceOnUse'%20color-interpolation-filters='sRGB'%3e%3cfeFlood%20flood-opacity='0'%20result='BackgroundImageFix'/%3e%3cfeBlend%20mode='normal'%20in='SourceGraphic'%20in2='BackgroundImageFix'%20result='shape'/%3e%3cfeGaussianBlur%20stdDeviation='100'%20result='effect1_foregroundBlur_654_7533'/%3e%3c/filter%3e%3c/defs%3e%3c/svg%3e)